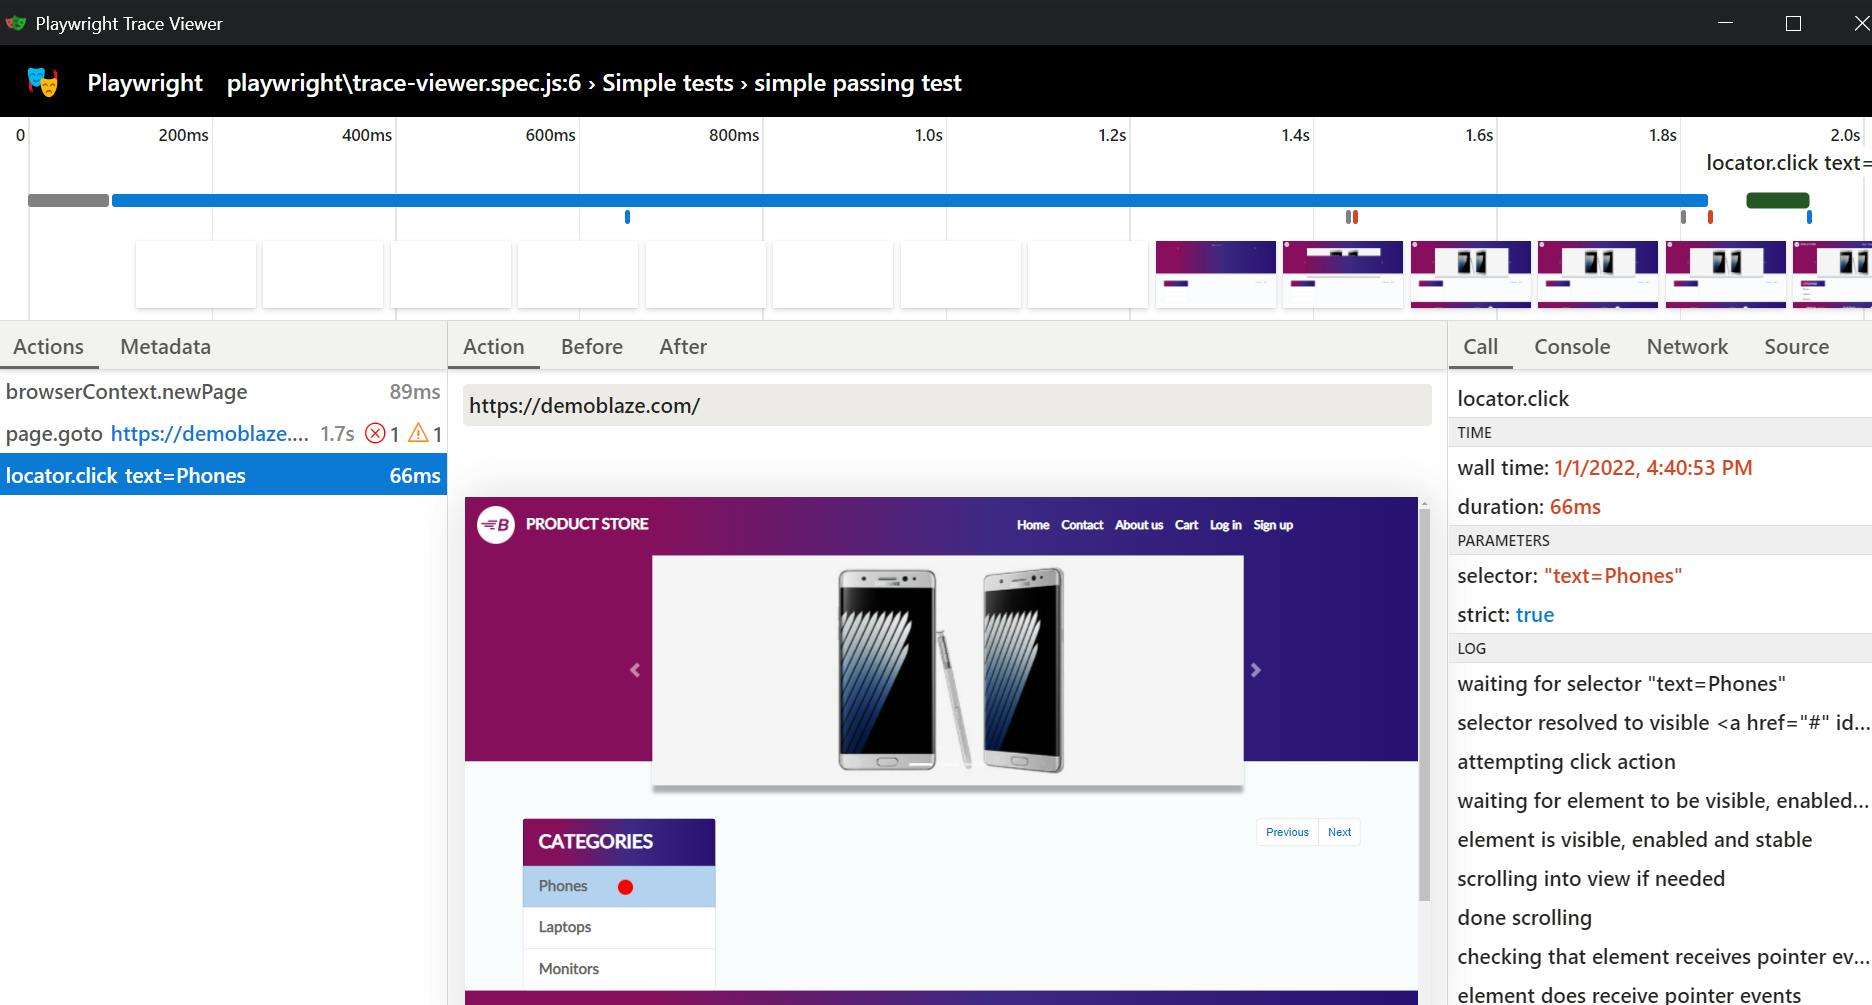
In this tutorial, we will learn about another GUI tool provided by Playwright called the Trace Viewer.
The Playwright Trace Viewer is a GUI tool that helps in exploring recorded Playwright traces after a tests script is executed.
Recording a Trace
We set the trace configuration in the Playwright configuration file, playwright.config.js.
For instance:
// playwright.config.js

const config = {
    retries: 1,
    use: {
        trace: 'on-first-retry'
    }
};

module.exports = config;
When you run a test with the above configuration, a trace.zip file would be created for each test that was retried.
When you specify the
retrieskey in the config file, Playwright retries the test until the test is passed or the maximum number ofretriesspecified is reached.
Available options for the trace key:
off- does not record a trace at allon- records a trace for each test ranretain-on-failure- record trace for each test but removes it when the test runs successfullyon-first-retry- record a trace only when retrying a test for the first time
Let’s practice now
Let’s configure trace to run on every test in the
playwright.config.jsfile and make use of theDesktop Chromedevice:// playwright.config.js // @ts-check const { devices } = require('@playwright/test'); /** @type {import('@playwright/test').PlayWrightConfig} */ const config = { use: { trace: 'on' // runs on every test }, projects: [ { name: 'chrome', use: {...devices['Desktop Chrome']} } ] }; module.exports = config;
Let’s create a test:
  // simple_test.spec.js

  const { test } = require('@playwright/test');

  test.describe('Simple tests',() => {
      test('simple passing test', async ({page}) => {
          await page.goto('https://demoblaze.com')
          await page.locator('text=Phones').click()
      });
  });
- Running the test with
npx playwright test simple_test.spec.jswould generate atrace.zipfile. You can view the trace by running this command in the CLI. (The
trace.zipfile is stored in thetest-resultsfolder:npx playwright show-trace path/to/trace.zipDoing this would open the Trace Viewer window now you can see the actions performed by the script.

- The
trace-viewershows the action on the script on the left side of the window and clicking each of the actions reveals:- action snapshot
- action log
- source code location
- network log for the action
- For instance, clicking on the
locator.click text=Phones:

The trace viewer is a really useful tool when you want to trace how some of your tests ran (flaky or failing).
You can play more around the tool. And read more on the official documentation.
